
Tableau Essential Training
Tableau is a powerful and versatile data analytics and visualization tool that many consider indispensable for data science work. Its drag-and-drop interface makes it easy to sort, compare, and analyze data from multiple sources, including Excel, SQL Serve ...
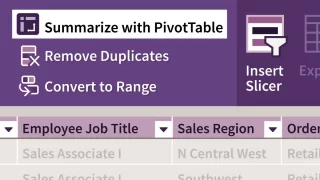
Excel: PivotTables in Depth
Many Excel users arenât sure how to use PivotTables. In this course, Excel power user Curt Frye shows you how to navigate the complexity of PivotTables while taking advantage of their power. Curt explains how to build PivotTables from single or multiple ...
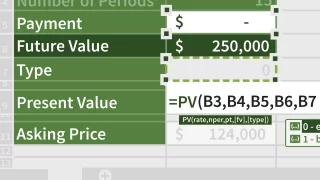
Excel: Financial Functions in Depth
Analyzing financial data can seem intimidating, but Microsoft Excel has a wide range of functions to perform these calculations quickly and easily. This course shows users how and when to use each of the financial functions available in Excel. Author Curt ...

Excel: Creating a Basic Dashboard
In this course, instructor Curt Frye shows you how to summarize spreadsheet data effectively to support decision-making throughout your organization. Curt explains how to set up a supporting workbook, including how to manage and filter data, streamline cha ...

Learning Excel What-If Analysis
Excel is a useful and versatile tool, but did you know you can also use it to analyze hypothetical business cases? Instructor Curt Frye walks you through the complete process. Curt begins by showing you how to create, define, edit, and delete scenarios, th ...